Target year under the UK Clean Power programme
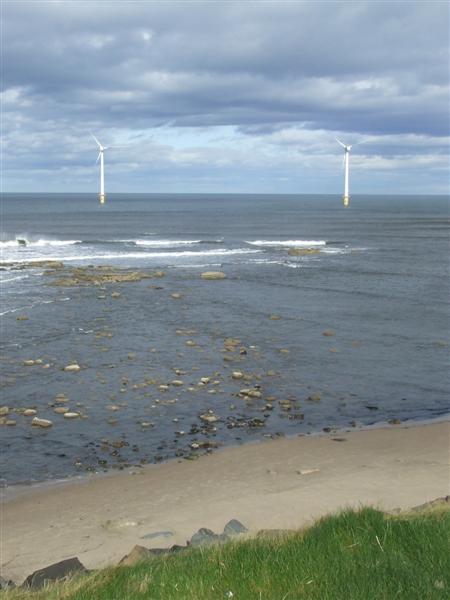
Generating more renewable power is only one part of the 2030 transition. Transmission capacity, connection queues and the difference between annual energy and hourly reliability are just as important.
Distinguish observed facts from projections, arguments and interpretations.
First distinguish the goal from the measurement
Clean Power 2030 is a policy ambition rather than a report that the electricity system has already met its goals. The UK government publishes metrics for clean electricity generation, the proportion of demand met by clean sources and the carbon intensity of power. These are different measures. A share calculated using generation does not always match a share calculated against domestic demand because of imports, exports, storage and losses.
The network can be the binding constraint
Onshore and offshore wind farms and new solar sites do not supply homes simply because construction has finished. They need grid connections and transmission routes. Britain’s official action plan specifically addresses reform of connection queues. In practical terms, a promising energy project can still be unable to deliver power at useful scale if a network upgrade is delayed. That affects investment timing, not only the headline renewable capacity count.
Why households might see uneven benefits
Clean generation can reduce exposure to fossil-fuel price swings, but the retail bill also includes network charges, supplier costs and policy costs. The timing of generation matters: when wind output is low and demand is high, the system may still rely on flexible generation, storage or imports. It is therefore incorrect to promise that a higher annual renewables share will produce an immediate, proportional cut in a household’s bill.
A more useful business question
For energy-intensive manufacturers and prospective data centres, the predictability and reliability of supply are often as important as the average wholesale price. The transition creates opportunities for grid equipment, storage, offshore engineering and balancing services. It also concentrates execution risk in planning, procurement and physical infrastructure. These are issues companies can evaluate using project-level grid milestones rather than political slogans.
How to follow progress responsibly
Use the official annual metric tables and methodology, then examine physical connections and generation dispatch through time. Do not treat a forecast of installed capacity as the same thing as delivered electricity. Equally, do not treat one unusually calm winter week as proof that a long-term policy has failed. A meaningful assessment needs both annual and hourly evidence.
What the headline leaves out
Britain’s Clean Power 2030 target has two annual accounting tests, not a promise that wind and solar alone will power every hour of 2030. Under the government’s definition, clean sources should generate at least as much electricity in a typical year as Great Britain consumes and at least 95% of Great Britain’s own generation should be clean. Reaching those annual shares also depends on networks, reserves, storage and the pace at which projects connect.
What the original numbers actually say
Read the period, units and definition in each row. These are distinct measurements, not personal forecasts.
| Measurement | Earlier period | Latest reference | What it means — and does not mean |
|---|---|---|---|
| Clean generation relative to annual demand | Government’s 2023 reference: about 56% | Target by 2030: at least 100% | A national annual-energy comparison; not proof that 100% of demand is met by clean power in every hour. |
| Clean sources as share of GB electricity generation | 2023 reference: about 60% | 2030 target: at least 95% | Share of electricity generated in Great Britain; different denominator from total demand. |
| Emissions intensity of electricity generation | 2023: 171 gCO₂e/kWh | 2030 target: well below 50 gCO₂e/kWh | Government plan’s carbon-intensity objective, not a percentage reduction in household bills. |
| Unabated gas in NESO-recommended system | — | No more than about 5% of total generation | The plan retains gas stations for reliability despite expecting relatively little annual generation from them. |
| Transmission expansion required | — | About twice as much new infrastructure by 2030 as built in the previous decade | Government scale estimate; not a confirmed count of completed lines. |
| Indicative clean-power investment programme | — | Around £40bn per year for six years | Government estimate of investment ambition, not guaranteed expenditure already completed. |
| Connection queue reform potential | — | Approximately 500 GW of queue capacity released | Projection in April 2025 reform annex conditional on implementation, not 500 GW of new generation energised. |
| Publication of progress indicators | — | 2025 data released 2 April 2026 | Latest dated official annual metrics identified at review; verify future releases before calling them current. |
| Annual example: 300 TWh of demand | — | 300 TWh clean energy could meet 100% annual demand on paper | Invented numerical example; no implication that supply arrives at the required hours. |
The deeper investigation
1. The definition includes clean output compared with demand and clean generation share
The Department for Energy Security and Net Zero’s Clean Power 2030 Action Plan specifies two related but distinct conditions for Great Britain in a typical weather year. Clean sources should generate at least as much electricity as total annual GB demand, and clean sources should account for at least 95% of generation taking place in Great Britain. The first compares the clean electricity produced with demand; the second measures the composition of GB electricity generation. Imports, exports, storage, network losses and the time of production mean these denominators are not equivalent. A household could be supplied at an hour when gas-fired generation or imported electricity is present and the national system could still satisfy the annual definition. Conversely, a network might have a high share of renewable generation during certain hours without meeting the full-year criteria. The government also aims for generation emissions intensity well below 50 grams of CO₂-equivalent per kWh, against 171g in its 2023 baseline. Treating that climate target as a future retail-price discount would confuse environmental intensity with money.
2. A capacity target is different from actual annual output and dependable capacity
Electricity systems are often discussed in gigawatts of installed wind, solar or storage, but installed power does not guarantee a constant annual flow of energy. Wind farms depend on wind conditions, solar output depends on daylight and season, and batteries can store only a finite amount of electricity before needing to recharge. A wind farm rated at one gigawatt will usually generate much less than 8.76 terawatt-hours a year because it does not operate continuously at its maximum output. The relevant annual output also depends on maintenance, network constraints and periods when operators reduce generation. For reliability, the system operator must know how much capacity is dependable during a cold, still evening when electricity demand is high. The government’s stated retention of gas stations for essential back-up is an acknowledgment of this technical distinction. A clean-energy programme therefore needs both enough annual renewable and other low-carbon electricity, and sufficient flexible or firm resources to balance demand at critical hours.
3. Why grid connection reform is nearly as important as building wind turbines
A generating facility that has secured planning permission is not necessarily connected to the electricity system. It needs transmission or distribution capacity, connection works and permission to export power safely. Britain’s old connection queue became congested with proposals at different stages of maturity, including schemes unlikely to be ready when first promised. The Clean Power 2030 Action Plan proposes reordering that queue according to project readiness and the technologies and regions needed for strategic planning, rather than reserving scarce capacity indefinitely under a simple first-come-first-served model. The April 2025 annex suggested that implementing reform could release around 500 gigawatts of queue capacity, or cut the queue by roughly two thirds. This is a forecast about removing or reprioritising proposed capacity from administrative queues, not a new 500 GW of built power stations. The practical success metric is how many viable projects obtain dependable connection dates, complete necessary works and actually begin delivering electricity.
4. Transmission lines create a trade-off between national benefit and local impact
The action plan says around twice as much new transmission infrastructure may need to be delivered by 2030 as Britain constructed in the previous decade. Connecting offshore wind, more onshore renewables and changing electricity demand requires substations, overhead lines, subsea cables and reinforcement of existing assets. A region hosting major new pylons may bear visual, land-use and construction disruption even if the power serves industrial or residential customers elsewhere. Nationally, improved transmission can reduce congestion and allow lower-cost generation to replace more expensive alternatives during some hours. Neither perspective can be dismissed. A project’s cost-benefit assessment must include expected usage, alternatives, land and environmental consequences, compensation arrangements and delays. Saying all grid investment is automatically beneficial ignores expensive misallocation; saying all new lines are unnecessary ignores the physical impossibility of moving electricity without capacity. The relevant planning documents, rather than a national slogan, reveal who receives benefits and bears costs.
5. The difference between market prices and what households ultimately pay
A higher clean-power share might reduce reliance on imported fossil fuels and limit exposure to some fuel-price spikes, but retail electricity bills reflect much more than generation. Networks need funding; balancing the system when supply and demand do not match has a cost; suppliers must purchase energy, administer accounts and comply with applicable tariffs and policies. Some investment can increase near-term charges even while aiming to produce longer-term benefits. Household gas bills are another issue: the Clean Power 2030 programme concerns electricity generation and does not directly replace all gas used in buildings. Consumers on fixed and default tariffs also face different timing of price changes. A government projection of a secure and affordable future system is an objective to test, not a promise that every household bill will decline by a specified percentage by 2030. A serious assessment tracks energy generation costs, the retail price cap, network charges and consumption on a consistent basis.
6. The gas backstop shows why 95% annual clean generation is not 100% hourly supply
The plan follows advice from the National Energy System Operator that a low-use fleet of gas stations should remain available when needed for electricity reliability, even though unabated gas generation is expected to represent no more than about 5% of total annual production in the intended 2030 system. A back-up power station may be required to sit idle or run only occasionally, but it still incurs maintenance and capacity costs. Clean sources supplying 95% of annual energy cannot alone prove that the electricity grid will withstand an extended winter period with little wind and weak sunlight. Storage and interconnectors can improve flexibility, but their contribution depends on charging opportunities, energy capacity and neighbouring system conditions. The debate is therefore not simply fossil fuel versus renewables: it concerns the affordable combination of low-carbon generation, network expansion and dependable reserves that can meet security standards without running gas plants unnecessarily.
7. The investment programme is not a booked achievement
The 2024 action plan describes an indicative clean-power investment opportunity on the order of £40 billion each year for six years. That large number may interest equipment suppliers, engineering firms and local authorities, yet it is a programme-level estimate, not a list of contracts already signed or verified capital spending. Suppliers need skilled labour, permitting decisions, finance, construction capacity and clear procurement timetables. Costs of transformers, cables and specialised vessels may change and some projects may be postponed. Policymakers can argue that rapid investment offers industrial opportunities and a route to lower emissions, while critics can point to disruption, delivery risk and costs ultimately borne by billpayers or taxpayers. To judge progress, follow projects awarded financing, turbines installed, grid assets completed and capacity actually delivered. Announced investment and realised productive infrastructure are different categories and should not appear as the same fact in an economic article.
8. What progress indicators can say — and what they cannot
The government’s official Clean Power 2030 metrics publication, last updated on 2 April 2026 with 2025 data, reports tables for clean-source shares of generation, clean energy compared with demand and the emissions intensity of generation. It also provides a methodology document because the definitions matter. The action plan’s historical 2023 illustrations describe around 60% clean electricity in GB generation, clean output amounting to about 56% of demand under the available UK proxy, and 171 grams of CO₂-equivalent per kWh. These should not be mislabelled as the 2025 observations. Forecasts published before the policy was implemented are similarly different from measured achievements. Analysts should download the updated tables, preserve the relevant GB or UK geographical basis, and observe the same metric over successive years. An isolated good windy month can be encouraging but does not demonstrate delivery of the full 2030 annual target; a single poor month likewise cannot prove permanent failure.
9. A practical checklist for evaluating the next clean-power announcement
When a new government statement promises more wind, solar or storage, ask whether it reports planned capacity, installed capacity, connection offers or measured electricity actually delivered. Check whether the unit is gigawatts of power, gigawatt-hours or terawatt-hours of energy, and whether the geographical boundary is Great Britain or the whole United Kingdom. For transmission developments, identify expected in-service dates and which grid bottleneck each project addresses. For bills, distinguish wholesale generation effects from network and policy charges, and separate annual spending projections from current tariffs. For reliability, look at gas back-up, imports, storage duration, the operational demand profile and the operator’s security assessment. The clean-power mission could deliver substantial benefits, yet policy success can only be established by a coherent set of dated measurements. Journalistic confidence should grow with actual completions rather than with the size of an announcement.
Annual energy versus hourly reliability: a simplified 300 TWh system
Purely hypothetical illustration unrelated to a DESNZ forecast or NESO grid simulation. Assume annual GB demand of 300 TWh, domestic generation of 320 TWh and 304 TWh from clean sources. Ignore trade, storage and losses to focus on definitions, then separately consider an hour with high demand and little wind.
Made-up annual demand, not a reported demand level in 2026 or a government prediction for 2030.
Annual clean output is greater than the 300 TWh demand, so the first target is satisfied in the simple accounting example.
Includes clean output plus 16 TWh from other generation.
The second annual target is exactly met in this illustrative system.
A result above 100% is mathematically possible with generation surplus and exchange; it is not 101.3% clean electricity available at every second.
Illustrates the potential need for storage, imports, responsive demand or a backup source of up to 20 GW. These values are invented.
Annual totals conceal temporal mismatches; grid-operator adequacy and security analysis remains necessary.
All 300/304/320 TWh figures and the winter-hour supply numbers are invented teaching examples. They ignore interconnectors, storage, curtailed power and actual 2030 hourly forecasts. Do not use them as evidence that Britain will have a real 20 GW shortfall.
The arguments, and what evidence they need
These are possible interpretations, not invented quotations from people we did not interview.
Households concerned about cost
A clean-electricity programme should ultimately help lower fuel exposure, but who pays for the lines and back-up?
What must still be established: Actual network tariffs, funding arrangements and wholesale market outcomes are required to evaluate net bill effects.
Wind and solar developer waiting for connection
Reforming the queue is essential so viable projects can deliver rather than wait behind projects unlikely to be built.
What must still be established: A smaller administrative queue does not automatically mean physical lines and substations have been completed.
Grid operator responsible for security
Even a highly decarbonised annual system needs sufficient flexibility and firm resources in difficult hours.
What must still be established: Hours of adequacy require simulation of weather, demand, storage, imports and the reliability of available units.
Frequently misunderstood details
Does the 2030 goal mean Great Britain will never burn gas for electricity?
No. The government expects gas stations to remain available for reliability but to supply only a small proportion of annual generation in the intended system.
Is the clean-power target just 95% renewable electricity?
No. The official definition has two annual metrics, and clean electricity includes relevant low-carbon sources beyond wind and solar.
Have the 500 GW of grid connections already been built?
No. The reform-annex figure refers to potential capacity released from an administrative queue, not new generation physically connected.
Does more renewable energy mean my bill falls by the same percentage?
No. Retail bills include energy, networks, balancing, supplier and policy costs, and depend on actual use and contracts.
Is the 2023 baseline the latest progress result?
No. The government published annual metrics with 2025 data on 2 April 2026; 2023 numbers are the original action-plan reference.
Does a system reaching its two annual clean targets automatically meet winter reliability standards?
No. Availability at specific hours and appropriate network and firm capacity are separate requirements.
What to monitor
Conclusions can change as new numbers and decisions arrive. Monitor these indicators.
- 01Annual clean-electricity metrics and their definitions
- 02Connections reform and transmission-project completion dates
- 03Hourly supply mix, imports and system balancing costs
Source documents
Read the underlying records to check units, reporting dates and subsequent corrections.